Technical Analysis is based on some assumptions. One of these assumptions is the idea that history repeats itself, in the case of forex trading, refers to price movements. The price movement is attributed to market psychology. There was a formation of patterns and it shows that in the past there were several same or similar reactions to the market stimuli over time. Those patterns in the charts are used to analyze the market movements and understand trends. These charts have been used for more than a century and are still relevant.
Second, price movements follow a trend. Once the trend is established, the future price movements likely to follow that particular pattern.
Third, it is assumed that factors such as a company’s fundamentals, the wide economic factors, and market psychology are all priced into the stock, hence there is no need to analyze these factors separately.
Now we need charts for the analysis. There are three types of charts namely Line Chart, Bar Chart, and Candlestick Chart.
Line Chart is the simplest of all other charts and is the best one if you only need an overview of the price movements. It is drawn from one closing price to another on any time span.
Candlestick Chart represents details of prices with candle-shaped bars. The black or red candle shows a bearish move. The white or hollow or green candle shows a bullish move. The largest area with four edges is the body. The verticals lines on the top and bottom of the body represent high and low price ranges in a chosen time frame. They form various shapes and patterns that reflect what’s going on in the market.
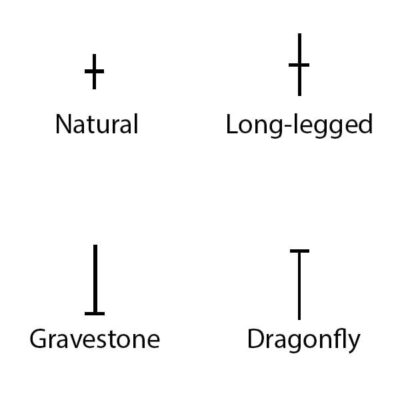
Doji pattern looks like a cross or a plus sign because the body has the same opening and closing price or has an extremely slim body that makes it appear like a dash over the candlewick. There are four common shapes of Doji – Natural Doji, Dragonfly Doji, Gravestone Doji, and Long-legged Doji.
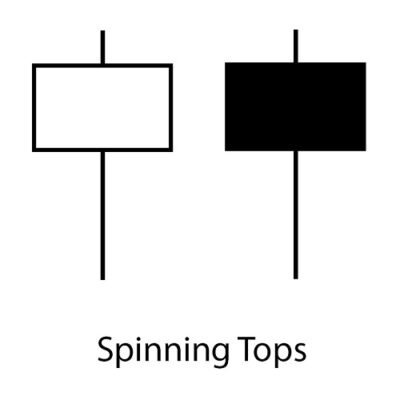
Spinning tops have a small short body that represents little or tight movement.
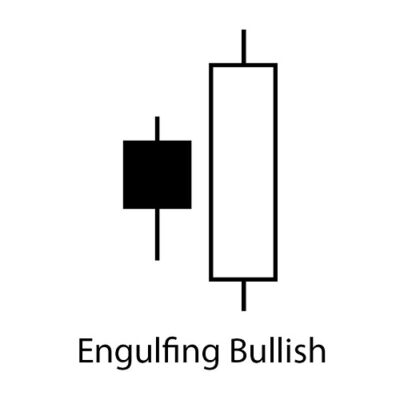
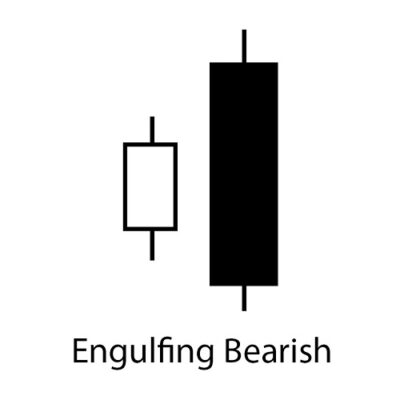
Bullish Engulfing pattern has longer white or green body engulfing a smaller black or red body which shows a reversal in trend. Bearish Engulfing has a long black or red body engulfing a smaller white or green body.
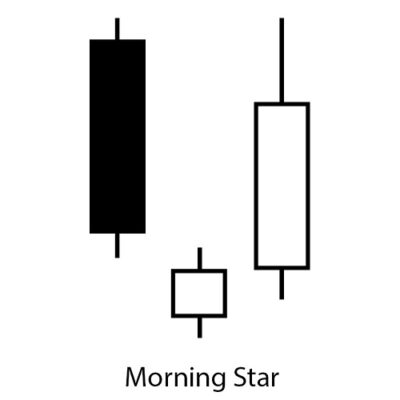
Morning Star pattern has a bearish candle followed by a small body below and a bullish candle.

Hammer can be a bullish or bearish candle with the body being near the high price.

Three Black Crows has three consecutive bearish candles with one candle near to the low of the previous candle.
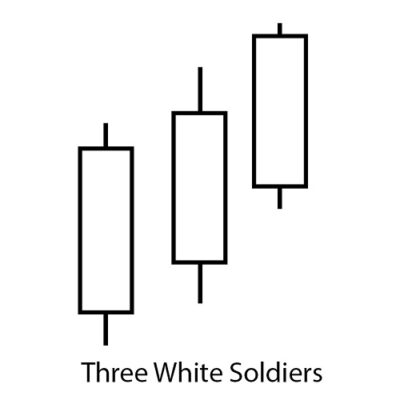
Three White Soldiers has three consecutive bullish candles with one candle near to the high of the previous candle.
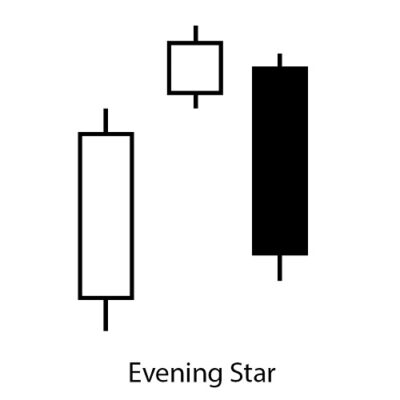
Evening Star has long bullish candle followed a small candle above the previous one with a gap. The third body is the bearish candle.
So these are some important charts and patterns that a trader uses to determine the present and potential price movement. Next time we will look into some more interesting things related to technical analysis. Stay updated!
